Reports
Gain insights into your team's performance with comprehensive analytics and reporting. Reports turn the time you track, the projects you run, and the…
Gain insights into your team's performance with comprehensive analytics and reporting. Reports turn the time you track, the projects you run, and the invoices you send into a clear picture you can act on.
Overview
Reports provides analytics tools to help you understand project progress, team productivity, and business metrics. Make data-driven decisions with dashboards and detailed reports. Because the underlying data already lives in Heyweek — tracked hours, project activity, invoices, and cash flow — your reports stay accurate and current without exporting and re-importing from other tools.
Key features
- Customizable dashboard — Arrange the metrics you care about as widgets across one or more pages.
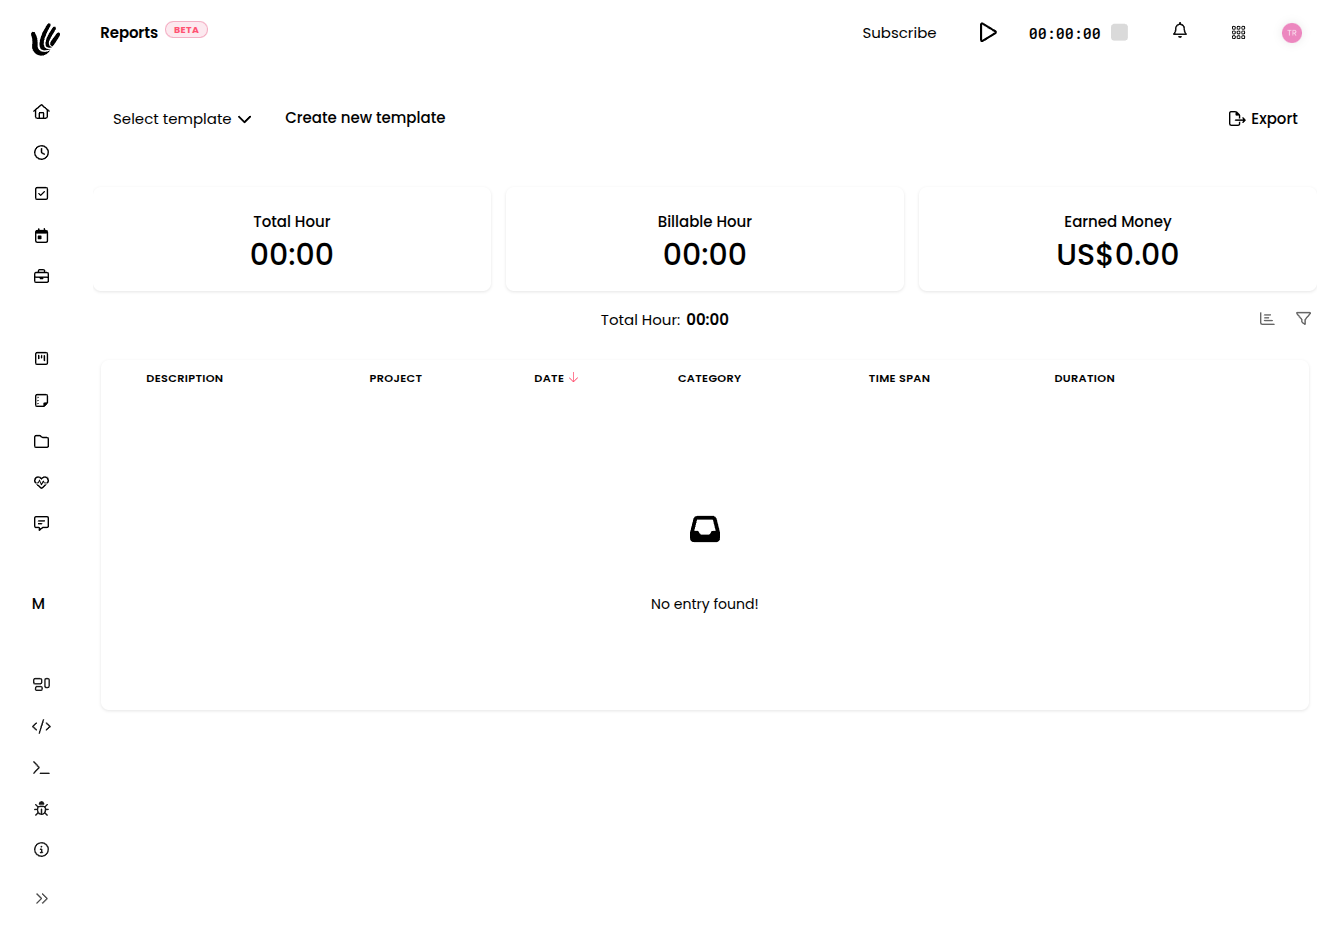
- Project reports — Status, progress, profitability, budget burn, and at-risk projects.
- Time reports — Time-tracking analytics and utilization, filtered the way you need.
- Team analytics — Individual and team performance metrics.
- Financial insight — Revenue by client, invoiced-vs-received, and per-project profitability.
- Saved report views — Save the filters and grouping you use often and reuse them.
- Filtering — Narrow any report by client, project, team member, or date range.
- Real-time data — Live numbers that reflect your latest work.
How it works
- Choose a report. Start from your dashboard or pick the report that answers your question.
- Set the scope. Filter by client, project, team member, or date range.
- Read the results. Review the metrics, trends, and breakdowns the report surfaces.
- Drill in. Narrow the filters to focus on a single client, project, or period.
- Save the view. Keep a filter and grouping setup you use often so it's one click next time.
- Act on it. Use what you learn to bill accurately and make decisions.
Available reports
Reports cover the main dimensions of your work:
- Time reports draw on your time tracking to show hours logged, billable versus non-billable work, and utilization across people and periods. Save the filters and grouping you use most as reusable views.
- Project reports summarize status, progress, profitability, and budget burn — so you can see how each project tracks against its plan and which ones are at risk.
- Financial insight brings together revenue from invoices and the costs in your cash flow for a view of profitability by client and project.
- Team analytics highlight how individuals and teams are performing.
Filtering and reading insights
A report is only as useful as your ability to focus it. Filter by client, project, team member, or date range to answer a specific question — how many hours went to one client last month, how a project's costs compare to its budget, or which work is most profitable. Narrowing the scope turns a broad overview into a precise answer.
As you read a report, look for the trends behind the totals: utilization climbing or falling, a project drifting past its estimate, or revenue concentrated in a handful of clients. These patterns are where the real value of reporting lives.
TIP
Start broad to spot what stands out, then add filters to zoom in. Comparing the same report across date ranges is often the quickest way to see a trend.
Using reports for billing
Time reports do double duty: they tell you how work is going, and they tell you what to bill. Before raising an invoice, use a time report filtered to a client or project to confirm exactly which billable hours should appear — so nothing slips through and nothing gets billed twice. The same data that drives your insights drives accurate billing.
NOTE
Reports and invoicing draw on the same tracked time. Reviewing a time report before you bill is a quick way to make sure the hours on the invoice match the work that was done.
Saving and reusing report views
The reports you run again and again don't need rebuilding each time. Once a time report is filtered and grouped the way you like — by client, by project, by team member, over your usual date range — save it as a view and bring it back in one click. Saved views keep your regular reporting consistent and fast.
When figures need to leave Heyweek — for a stakeholder, an accountant, or your own records — you can export your data to take it with you.
Works with the rest of Heyweek
- Time reports build on Time Tracking.
- Project reports reflect your projects and the clients behind them.
- Financial insight combines invoices and cash flow.
- See everything the feature offers on the Reports feature page.
Tips
- Filter by date range and compare periods to surface trends, not just snapshots.
- Run a time report by client before invoicing to make sure every billable hour is captured.
- Save the report views you rely on so they're one click away next time.
- Keep your time and transactions tagged consistently — clean data makes for clear reports.